© 2026 usetools. All rights reserved.
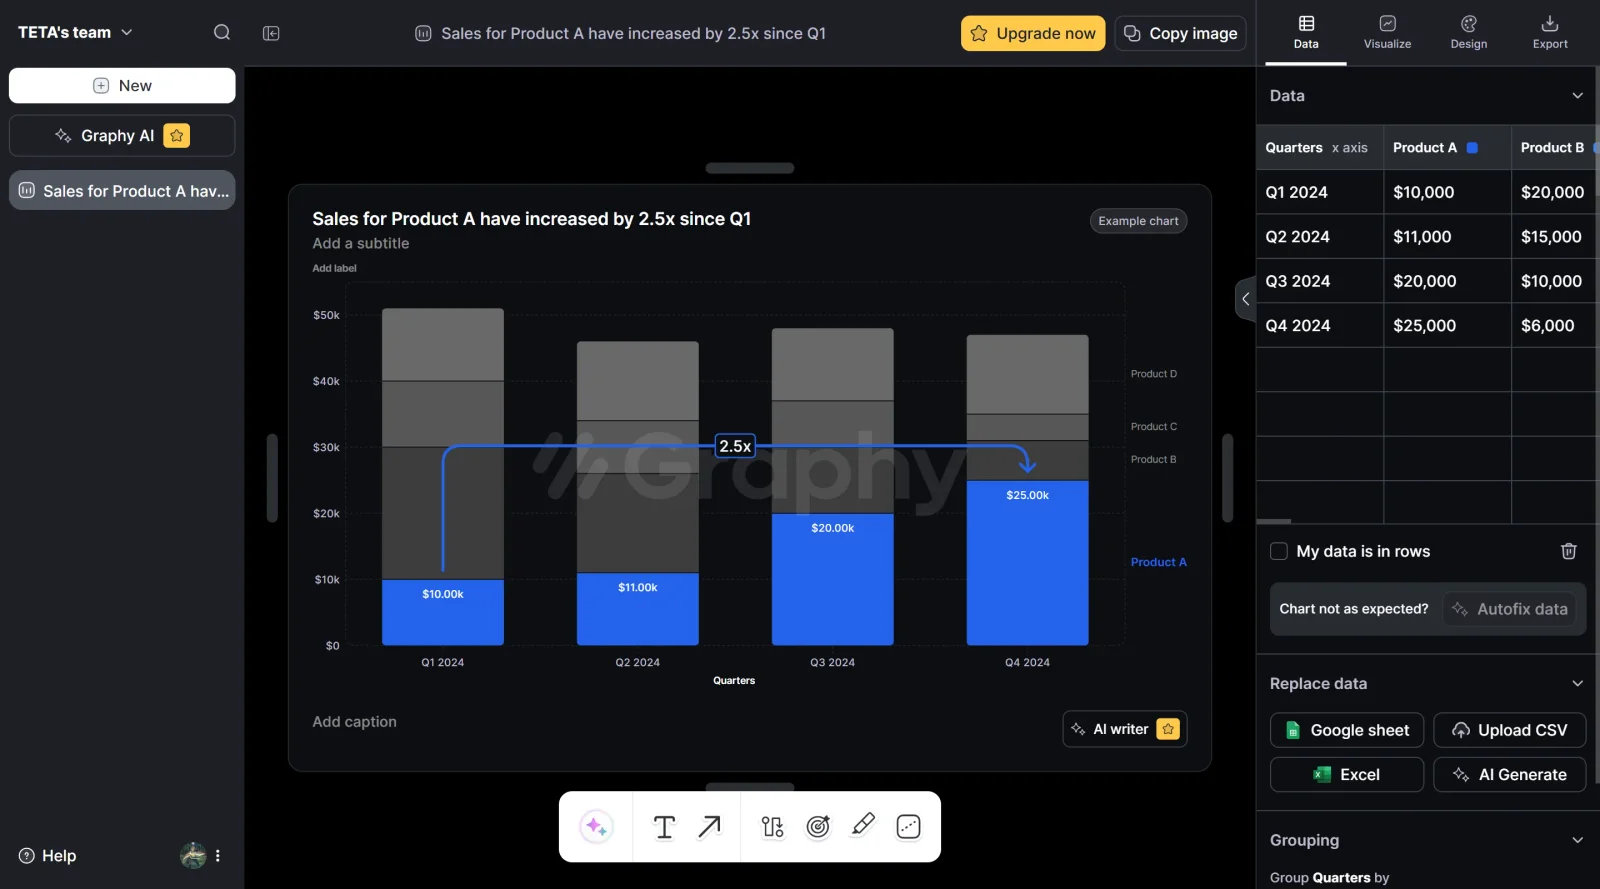
Graphy is a free-to-paid data visualization tool designed to transform raw data into interactive graphs and charts without requiring coding expertise. As an AI-powered solution, Graphy simplifies the process of creating visual representations of data by accepting input from multiple sources—Google Sheets, CSV files, Excel spreadsheets, or manual data entry—and automatically generating professional visualizations. The tool fits into the broader category of UX and design tools, serving users who need to communicate data insights visually but lack advanced technical skills.
Graphy serves workflows where data needs to be communicated clearly across teams or to external audiences. Common use cases include:
Graphy is well-suited for marketers, business analysts, data professionals, and team leads who regularly need to present findings or communicate trends but may lack expertise in advanced visualization software. The tool appeals to users prioritizing speed and ease of use over deep analytical capabilities, making it accessible to both beginners and experienced professionals. Organizations seeking collaborative visualization workflows will find the team features particularly useful. Visit Graphy
Discover more design resources
Explore our comprehensive design glossary to master essential terminology from A/B Testing to Wireframes.
Browse GlossarySearch through our entire collection of design tools and resources
Mode turns your product’s codebase into editable canvas frames. Refine real UI with visual controls, experiment with AI then share or hand off for review.
Prompt Creek is a free community-driven repository featuring thousands of AI prompts. Discover, bookmark, and share quality prompts for ChatGPT, Claude, and other AI tools.
Vatis Tech is the most powerful speech-to-text infrastructure. It can be used to transcribe user interviews and client meetings.
Accelerate website creation without needing to code.
19 tools